Tips and tricks for creating figures in tikz 27 January 2014
This post is a continuation of creating publication quality figures. As you might imagine, the process of creating figures using matlab2tikz is not always as smooth as in the case of simple figures. I have come across a few bugs, and here I will try to present simple workarounds for most cases.
Bar graphs
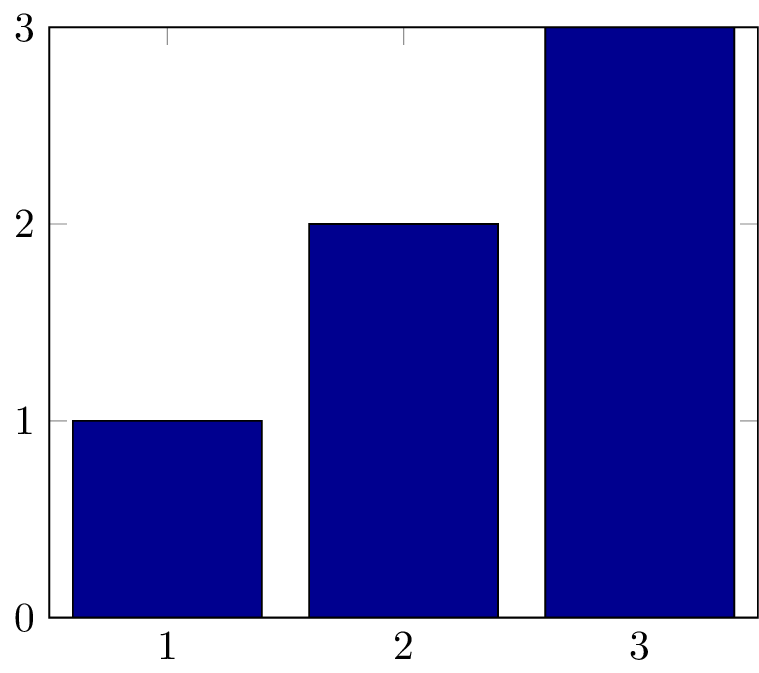
Bar graphs generated using different commands are treated differently. Exporting a simple bar graph created by:
x=[1,2,3];
y=x;
bar(x,y);
matlab2tikz('bar.tikz', 'showInfo', false, ...
        'parseStrings',false,'standalone', true, ...
        'height', '5cm', 'width','6cm');
results in the following compiled pdf figure:
But, if we use a command such as hist:
x=randn(1000,1);
hist(x);
matlab2tikz('hist.tikz', 'showInfo', false, ...
        'parseStrings',false,'standalone', true, ...
        'height', '5cm', 'width','6cm');
The generated pdf figure will be somehow different from what we expect:
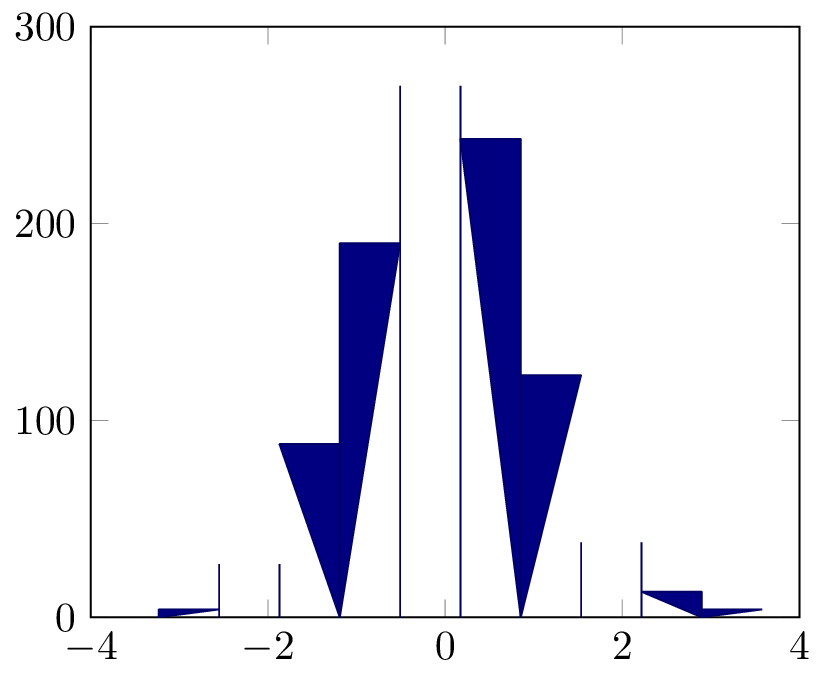
This is a documented bug in matlab2tikz. In most cases, it can be mediated by using the bar command instead of the hist for drawing the figure:
x=randn(1000,1);
[nelements,centers]=hist(x);
bar(centers, nelements);
matlab2tikz('hist_bar.tikz', 'showInfo', false, ...
        'parseStrings',false,'standalone', true, ...
        'height', '5cm', 'width','6cm');
So that we get the expected figure:
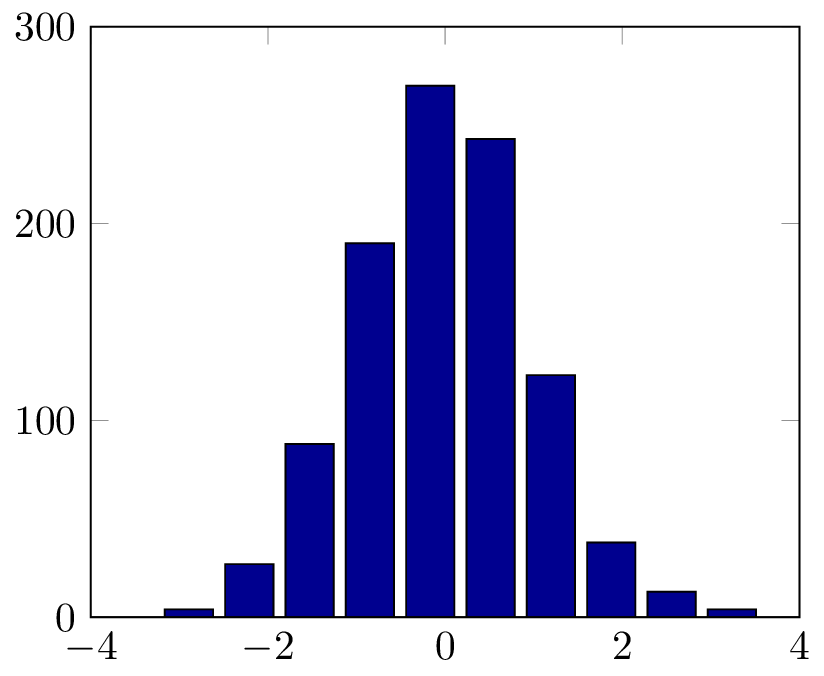
Figure alignment
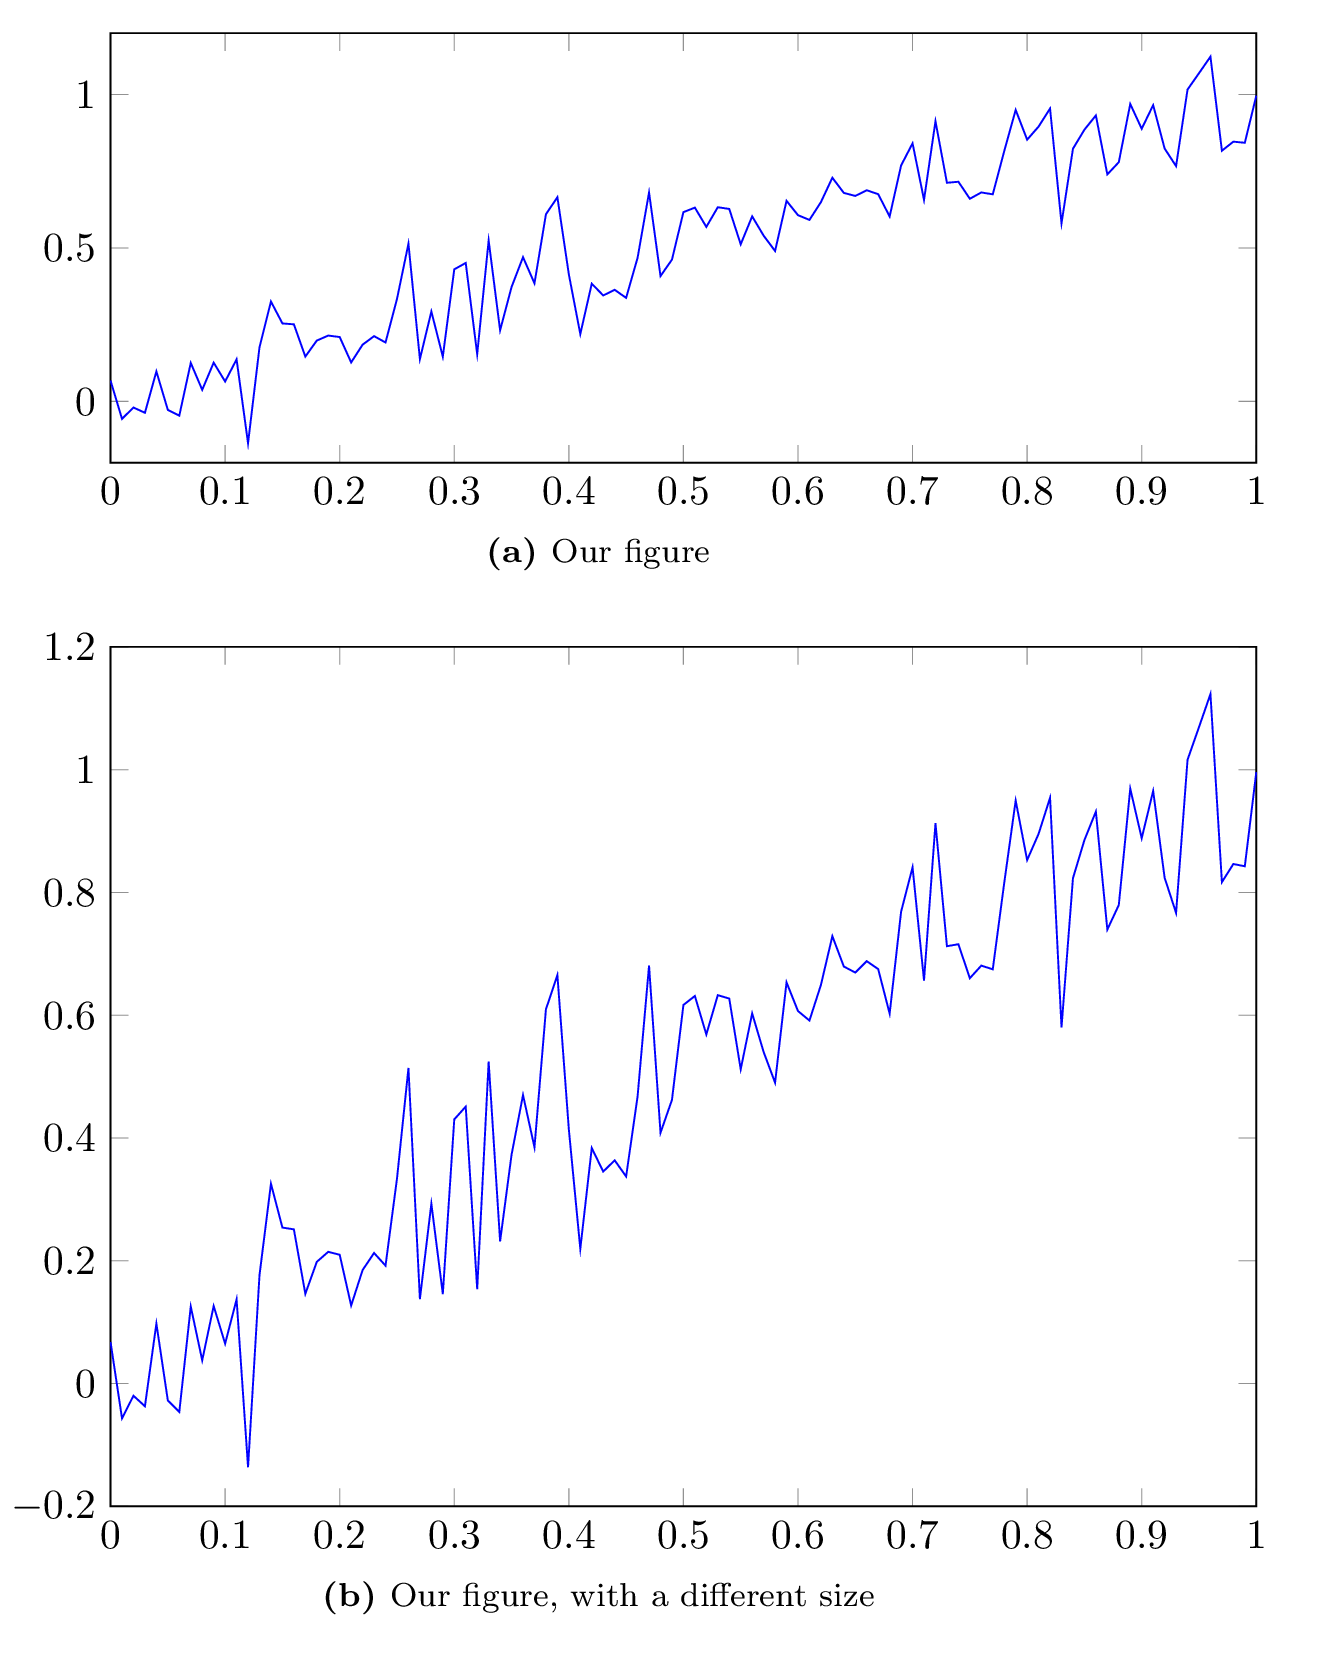
The width and height variables set when running matlab2tikz refer to the width and height of each axis, and not the width and height of the whole figure (including labels, tick labels, etc.). This can results in figures being misaligned, as is the case of the last figure in the previous post. This problem is more severe in the case of figures with multiple subfigures. One way of getting rid of this issue is by using a fixed width for tick labels on the y-axis. This can be accomplished by adding the specifying the width inside the figure:
\documentclass[a4paper]{article} \usepackage[utf8]{inputenc}
\usepackage{subfig,float} \usepackage[english]{babel}
\usepackage{tikz, pgfplots}
\usepackage[font=normal,labelfont=bf]{caption}
\pgfplotsset{ % Here we specify options for all figures in the document
  compat=1.8, % Which version of pgfplots do we want to use?
  legend style =
  {font=\small\sffamily},
  label style = {font=\small\sffamily}
}
\begin{document}
\newlength\figureheight
\newlength\figurewidth

\begin{figure}[h]
% y-axis tick label width
\pgfplotsset{yticklabel style={text width=3em,align=right}}
  \subfloat[][Our figure]{ \setlength\figureheight{0.3\textwidth}
    \setlength\figurewidth{0.8\textwidth} \input{fig8.tikz}
  }\\
  \subfloat[][Our figure, with a different size]{
    \setlength\figureheight{0.6\textwidth}
    \setlength\figurewidth{0.8\textwidth} \input{fig8.tikz} }
              \end{figure}
\end{document}
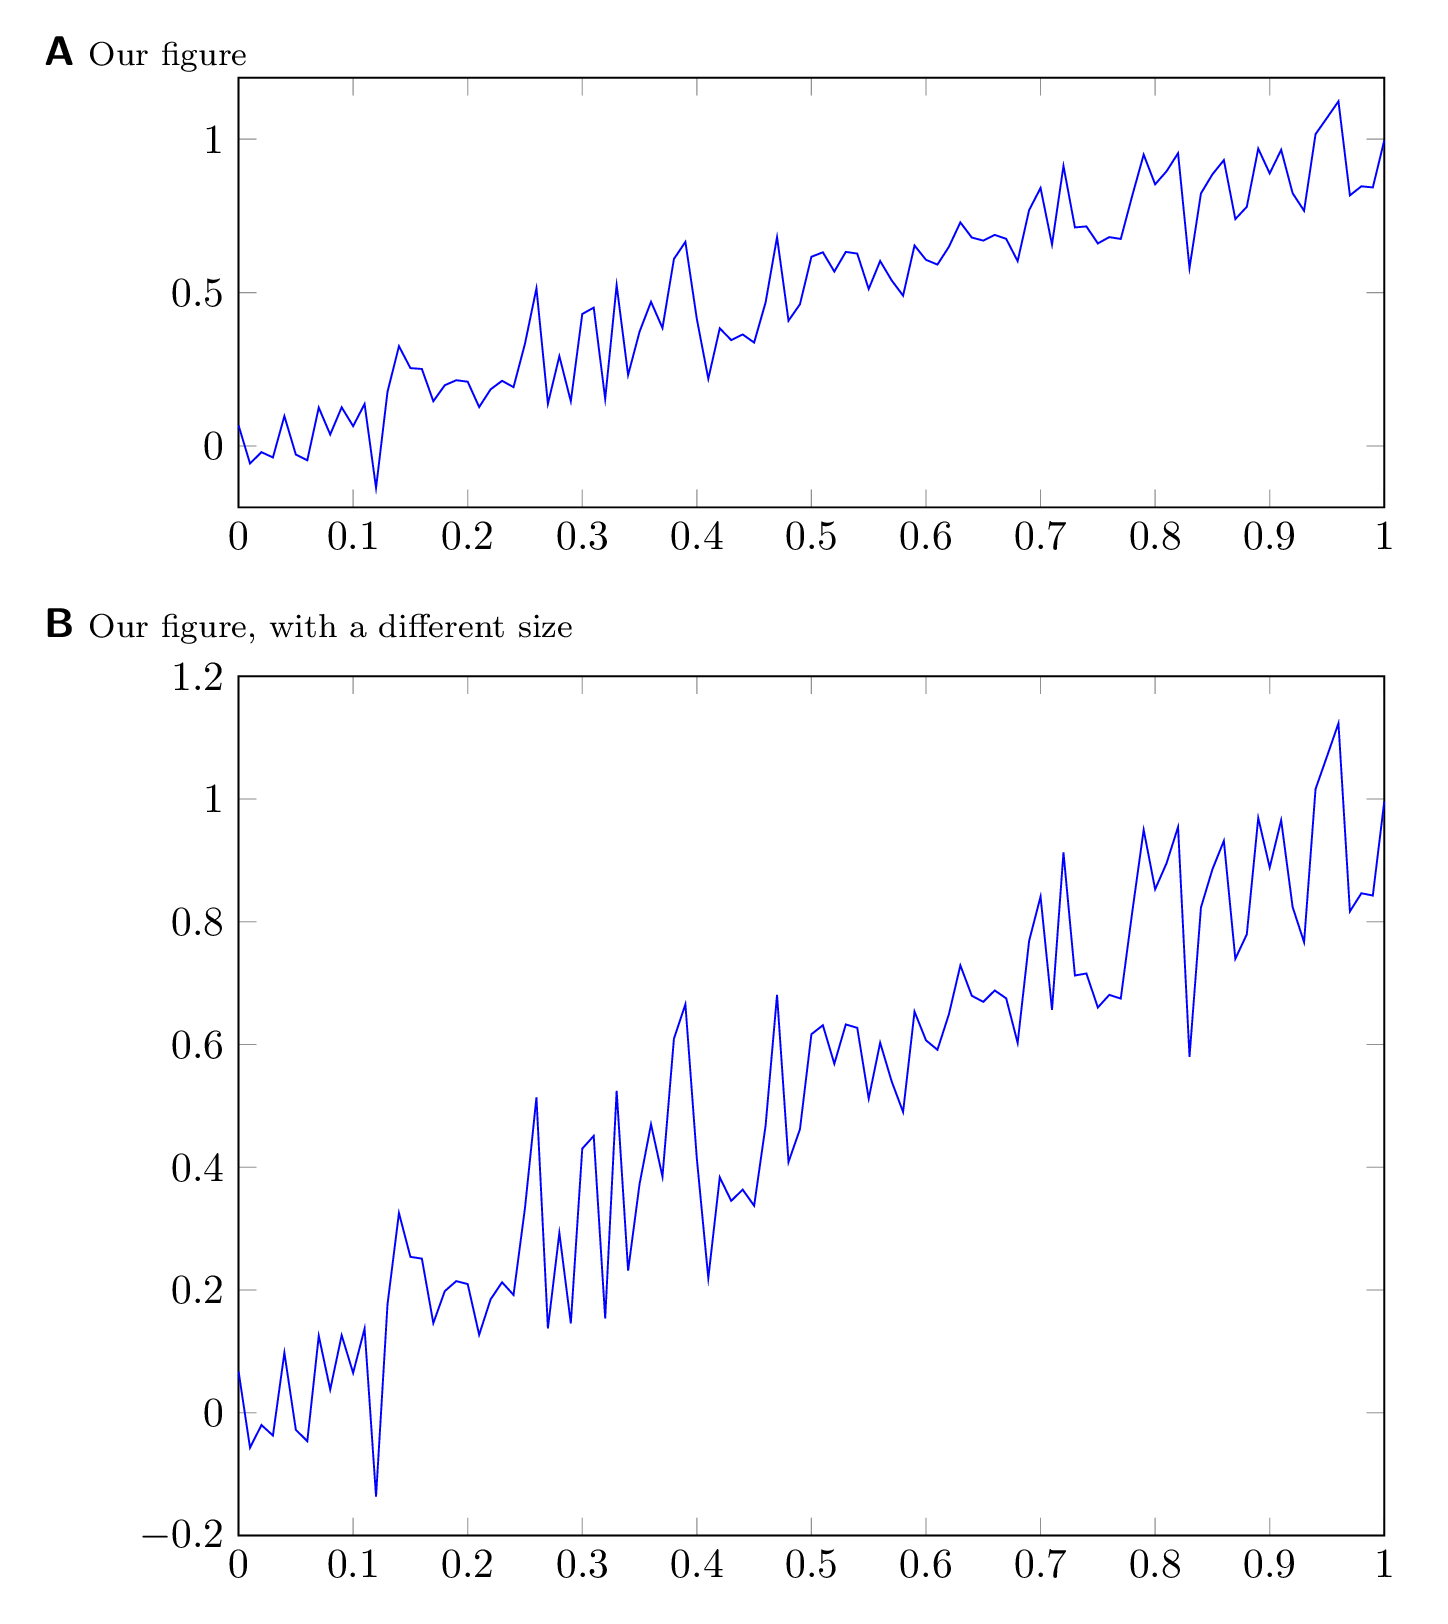
Regenerating our latex document now results in perfectly aligned figures:
Subfigures
There are two ways to generate subfigure using this method.
- In Matlab
We can generate a figure with subfigures in Matlab and save it as one figure.
- In LaTeX
The other solution is to export each subfigure independently, and put them together in Matlab. I personally prefer this method because it gives me the highest amount of control over the presentation of subfigure, and allows fancy tricks such as referencing subfigures.
An example of the second method is already shown in the previous section. We can improve it by making sure that subfigure numbers are written as required by most journals. I found the following command on this great page.
% set package options
\captionsetup[subfloat]{position=top,singlelinecheck=false,labelfont={normalsize,sf},
  labelformat=simple,listofformat=subparens,aboveskip=0pt,parskip=0pt,farskip=5pt,
  captionskip=0pt}

% customize subfigure label to capitals
\renewcommand{\thesubfigure}{\textbf{\Alph{subfigure}}}
Adding this command right before our figure in the LaTeX document results in:
Cache generated figures
Generating figures from tikz files is a relatively expensive (read long) operation. If you are working on one figure, it might be annoying to have to wait for all the other figures in your document to be generated as well. Fortunately, LaTeX can save generated figures as independent pdf files, and include them automatically instead of regenerating them from scratch.
Create a folder next to your LaTeX document called autofigs, and add this line to the header (before \begin{document}) of the latex document
\usetikzlibrary{external} \tikzset{external/system call={lualatex
    \tikzexternalcheckshellescape -halt-on-error
    -interaction=batchmode -jobname "\image" "\texsource"}}
\tikzexternalize[prefix=autofigs/]
And make sure to compile the resulting document using the –shell-escape option:
pdflatex --shell-escape doc.tex
Once compiled, the autofigs folder will contain pdf files, one per figure. Recompiling the document will not require regeneration of all figures, and is therefore much faster.
There is one caveat though. Changes in tikz files are not automatically detected. If you want a figure to be changed you will need to delete the corresponding files in the autofigs folder.
blog comments powered by Disqus