Dressing room statistics 14 May 2012
Last weekend, one of my friends and I found ourselves waiting near the exit of dressing rooms in a busy London clothes shop. In that shop, anyone going in the dressing rooms was given a small plastic panel with a number corresponding to the number of articles of clothing she wanted to test. Each customer was only allowed to bring 6 articles inside. At the exit, an employee takes the small piece of plastic back, along with all unwanted items which will then be put back on shelves and racks inside the store.
As we were standing right next to that lady, we started to notice that very few customers would actually buy anything. We saw a lot of people coming out of the dressing room with 4,5 or even 6 articles of clothing, and give them all back. Being bored, we thought it would be a good idea to actually record this data, and analyse them.
We took notes of how many items were tried buy each person, and how many were kept. In the approximately 20 minutes we spent there, we saw 75 customers come out of dressing rooms. Here is the histogram of the number of items they had brought in (according to the small plastic panel).
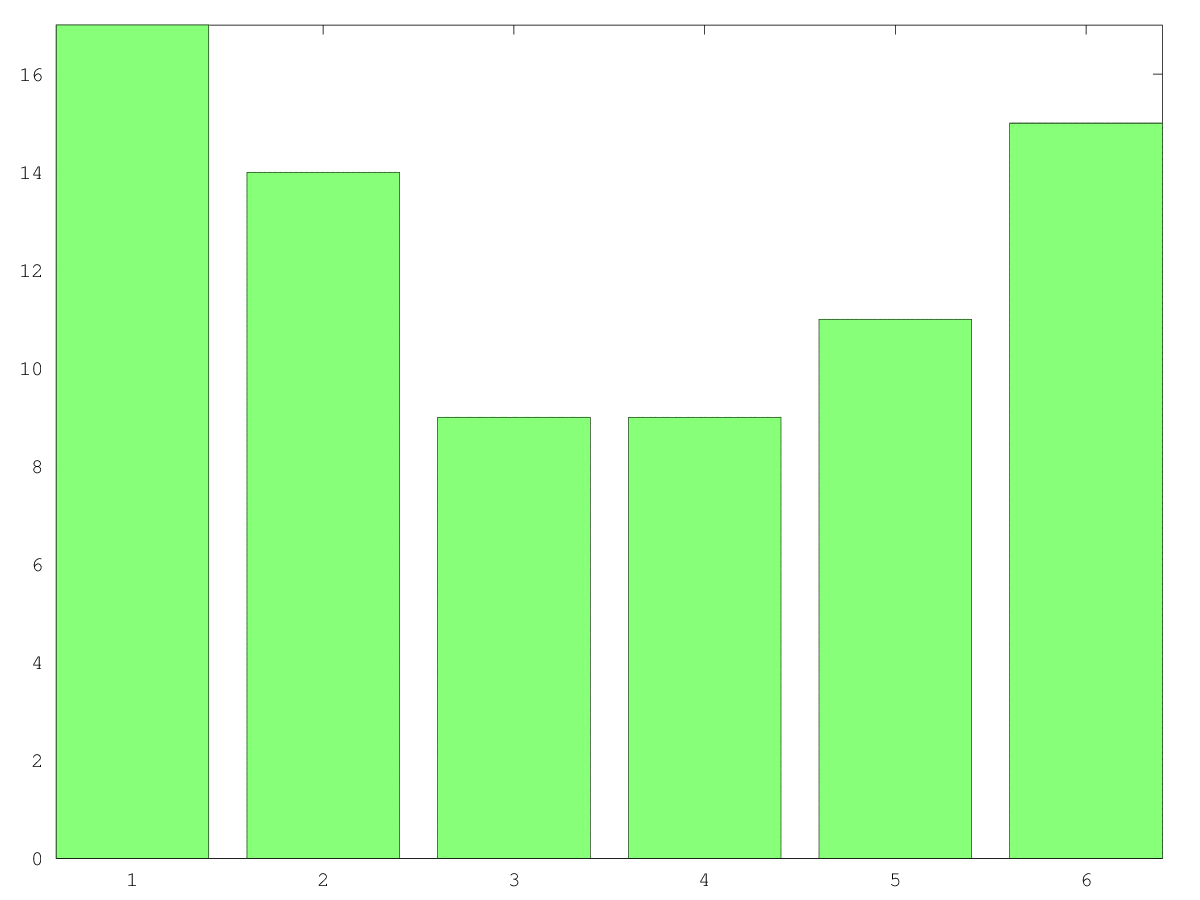
We can already see some interesting trends. There are two peaks in this histogram, suggesting two types of customers : Those who bring few (1 or 2) articles, and those who want to try many items on (5 or 6). In comparison, few customers bring 3 or 4 items. But how does this translate into sales? Let’s have a look at the histogram of items kept.
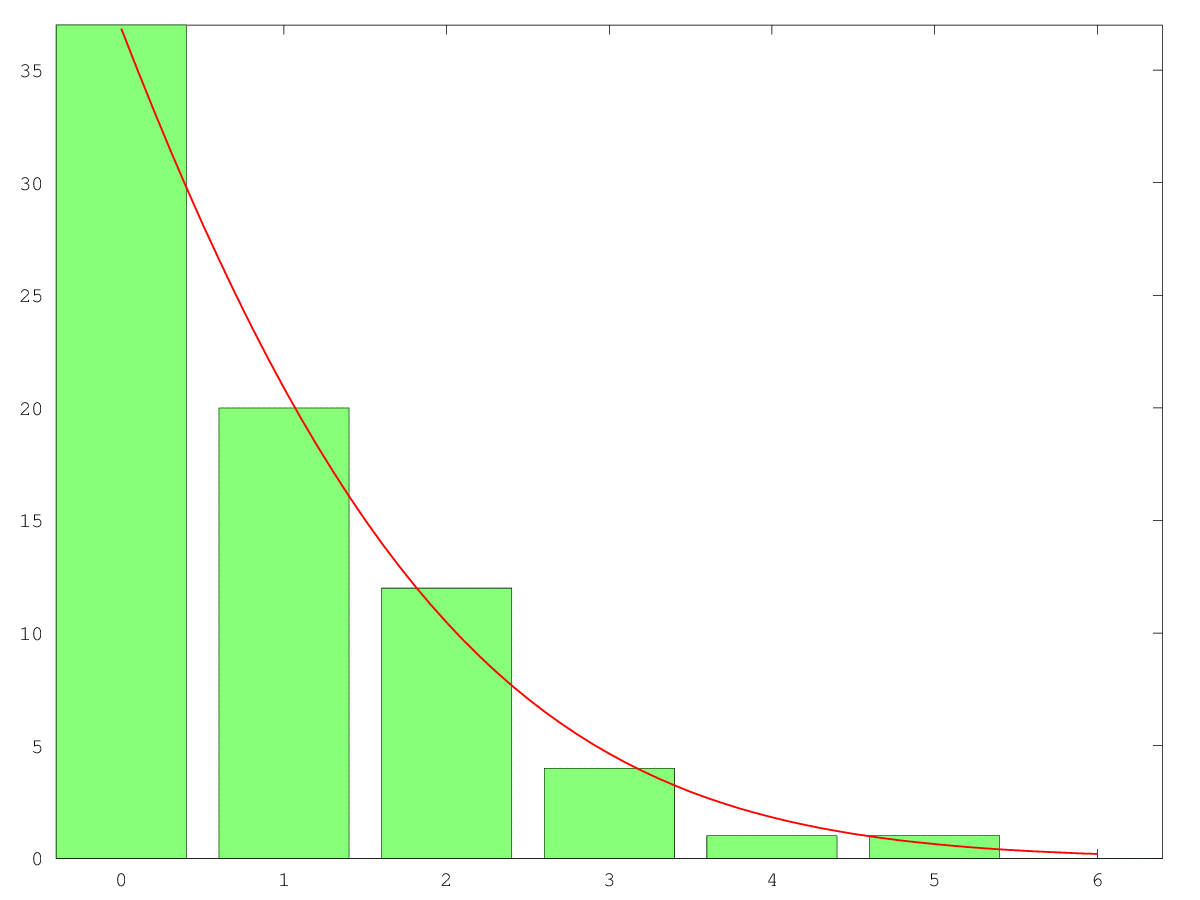
As you can see, the number of articles finally kept does not really look like the number of articles brought into the dressing room. In fact, the number of articles kept can be closely matched by what we call the gaussian distribution. That is the redline you can see on the figure. It is very frequently encountered in nature. So frequently, in fact, that we also call it the normal distribution.
So we know that some people go in with a lot of clothes, and some with very few. We also know that the number of articles kept obeys the normal distribution. But what we would like to know is how does the number of articles brought in correlate with the number of articles brought out. In other words, we want to know if we can predict how many articles of clothing someone will end up buying based on how many the bring into the dressing room.
We can accomplish this by quite easily. In the following graph, you can see the mean number of articles kept, as a function of number of articles brought in the dressing room :
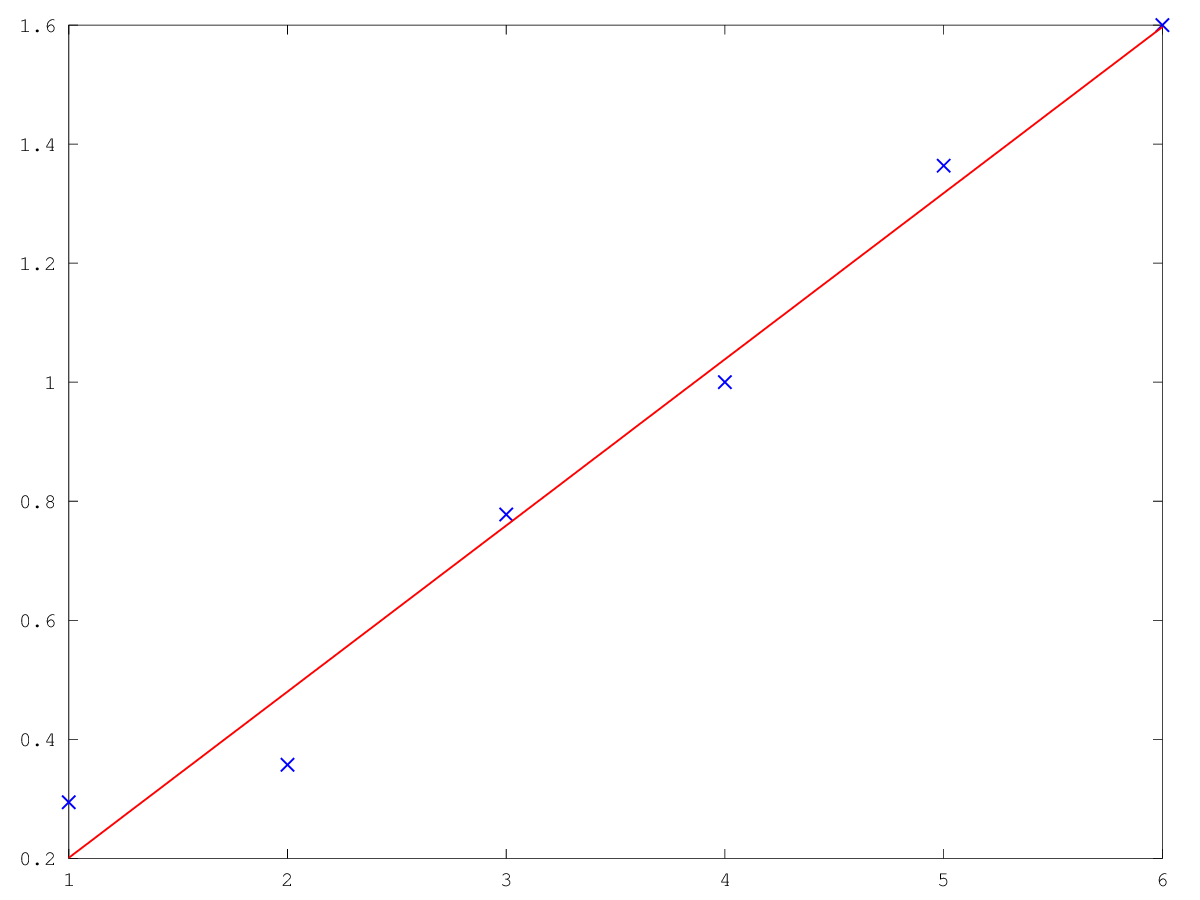
The numbers fit nicely on a line, with a slope of 0.28 (drawn in red). Roughly speaking, for every 100 items tried on in that shop’s dressing room, only 28 are bought. The remaining 72 have to be put back on shelves by the staff. We can also see that the number of clothe brought in can be a pretty good indicator of how many will be bought. The more items brought in, the more items are kept.
But, while we were recording the data, we actually noticed a pretty large number of people who actually did not seem to want to buy anything. They seemed just to be interested in trying clothes with their friends, and giving them all back afterwards. And we wondered, do they somehow skew our data? Is there something to be learnt by eliminating them from our dataset? Have a look at this next graph.
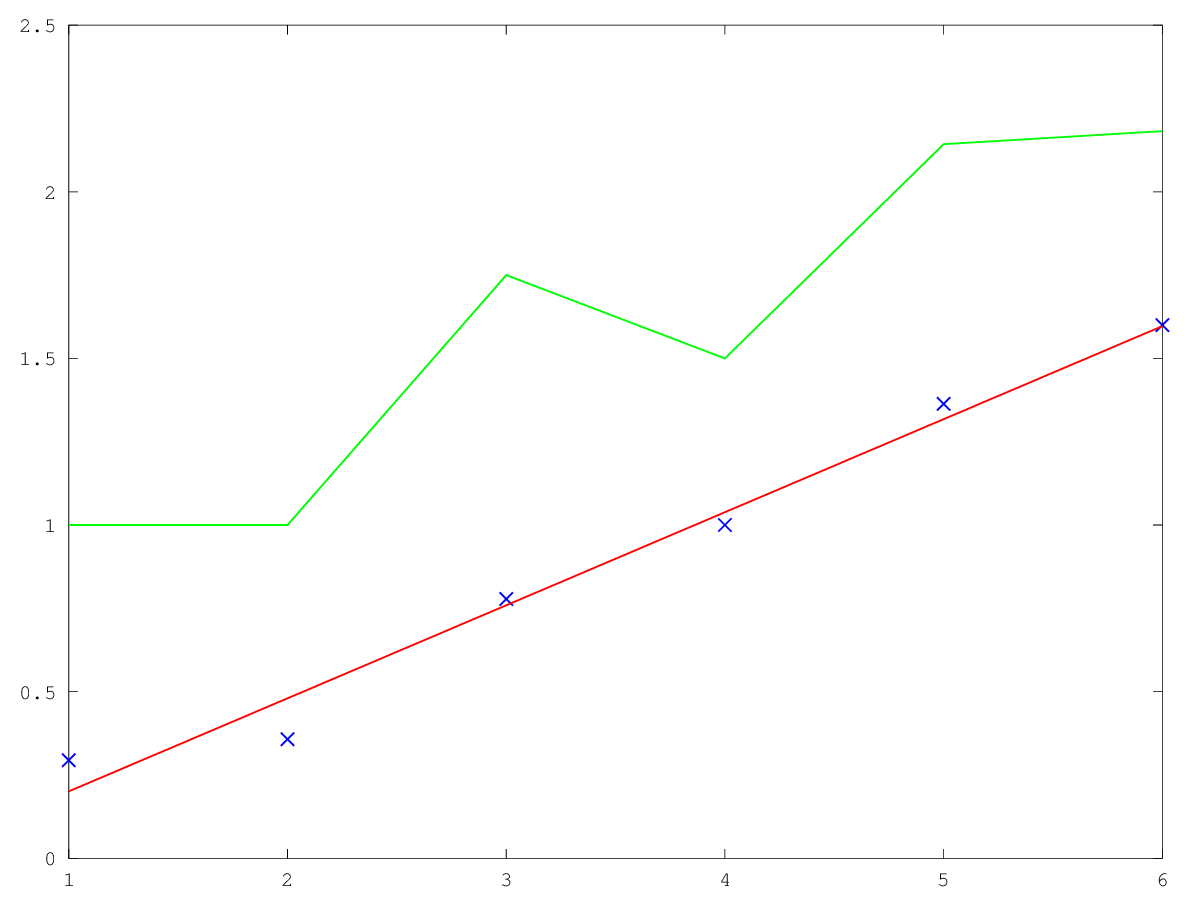
Here you can see the same data than on the last graph, but we have added another curve. In green you can see the mean number of articles bought if we exclude those who do not buy anything. There is something funny about this graph. It seems that people who bring in 4 items actually end up buying less than people who brought in only 3. I do not know if there is any truth behind this observation, or if it is just due to a small number of samples. other than that, the trend of “The more you bring in, the more you buy” seems to hold.
blog comments powered by Disqus